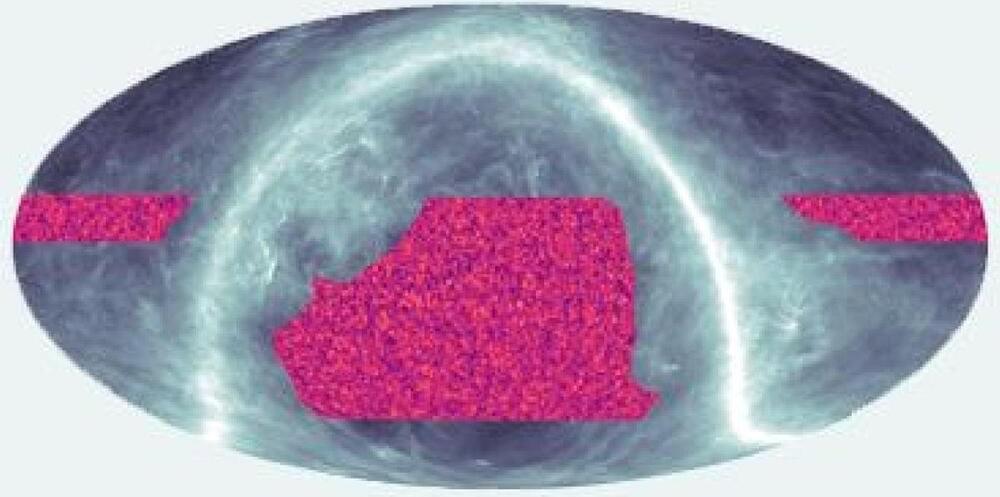
The mapping of matter in the cosmos helps to confirm Einstein’s theory of general relativity and reveals more about mysterious dark matter.


The deployment of his spy ships is chilling. Britain is far from ready to counter whatever he has planned.
For a long time it was only speculation. Now we know for certain: Russian spy ships are mapping wind farms and key cables off the British coast. There can be only one reason for this – to learn how to sabotage UK and European critical infrastructure in the event of a full-scale war with the West.
The sobering truth is that our potential adversaries, Russia in the West and China in the East, are gearing up for wider conflict. That does not mean that conflict will happen –preparation makes it less likely – but we must urgently recognise the extent of the threat to the current order. Our world is becoming markedly more dangerous. And Britain is not ready.

face_with_colon_three year 2017.
First observed in liquid helium below the lambda point, superfluidity manifests itself in a number of fascinating ways. In the superfluid phase, helium can creep up along the walls of a container, boil without bubbles, or even flow without friction around obstacles. As early as 1938, Fritz London suggested a link between superfluidity and Bose–Einstein condensation (BEC)3. Indeed, superfluidity is now known to be related to the finite amount of energy needed to create collective excitations in the quantum liquid4,5,6,7, and the link proposed by London was further evidenced by the observation of superfluidity in ultracold atomic BECs1,8. A quantitative description is given by the Gross–Pitaevskii (GP) equation9,10 (see Methods) and the perturbation theory for elementary excitations developed by Bogoliubov11. First derived for atomic condensates, this theory has since been successfully applied to a variety of systems, and the mathematical framework of the GP equation naturally leads to important analogies between BEC and nonlinear optics12,13,14. Recently, it has been extended to include condensates out of thermal equilibrium, like those composed of interacting photons or bosonic quasiparticles such as microcavity exciton-polaritons and magnons14,15. In particular, for exciton-polaritons, the observation of many-body effects related to condensation and superfluidity such as the excitation of quantized vortices, the formation of metastable currents and the suppression of scattering from potential barriers2,16,17,18,19,20 have shown the rich phenomenology that exists within non-equilibrium condensates. Polaritons are confined to two dimensions and the reduced dimensionality introduces an additional element of interest for the topological ordering mechanism leading to condensation, as recently evidenced in ref. 21. However, until now, such phenomena have mainly been observed in microcavities embedding quantum wells of III–V or II–VI semiconductors. As a result, experiments must be performed at low temperatures (below ∼ 20 K), beyond which excitons autoionize. This is a consequence of the low binding energy typical of Wannier–Mott excitons. Frenkel excitons, which are characteristic of organic semiconductors, possess large binding energies that readily allow for strong light–matter coupling and the formation of polaritons at room temperature. Remarkably, in spite of weaker interactions as compared to inorganic polaritons22, condensation and the spontaneous formation of vortices have also been observed in organic microcavities23,24,25. However, the small polariton–polariton interaction constants, structural inhomogeneity and short lifetimes in these structures have until now prevented the observation of behaviour directly related to the quantum fluid dynamics (such as superfluidity). In this work, we show that superfluidity can indeed be achieved at room temperature and this is, in part, a result of the much larger polariton densities attainable in organic microcavities, which compensate for their weaker nonlinearities.
Our sample consists of an optical microcavity composed of two dielectric mirrors surrounding a thin film of 2,7-Bis[9,9-di(4-methylphenyl)-fluoren-2-yl]-9,9-di(4-methylphenyl)fluorene (TDAF) organic molecules. Light–matter interaction in this system is so strong that it leads to the formation of hybrid light–matter modes (polaritons), with a Rabi energy 2 ΩR ∼ 0.6 eV. A similar structure has been used previously to demonstrate polariton condensation under high-energy non-resonant excitation24. Upon resonant excitation, it allows for the injection and flow of polaritons with a well-defined density, polarization and group velocity.
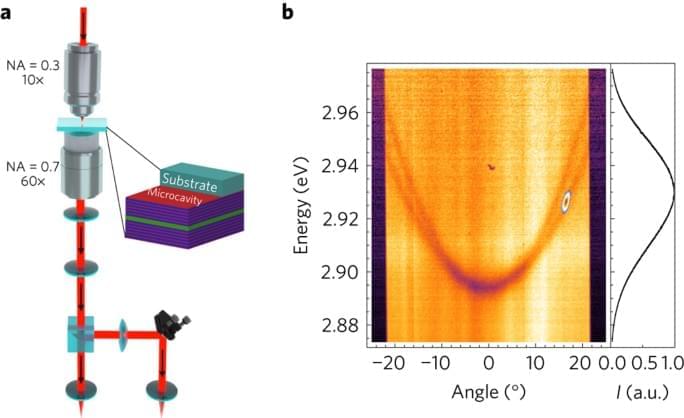
The experimental configuration is shown in Fig. 1a. The sample is positioned between two microscope objectives to allow for measurements in a transmission geometry while maintaining high spatial resolution. A polariton wavepacket with a chosen wavevector is created by exciting the sample with a linearly polarized 35 fs laser pulse resonant with the lower polariton branch (see Methods). By detecting the reflected or transmitted light using a spectrometer and a charge-coupled device (CCD) camera, energy-resolved space and momentum maps can be acquired. An example of the experimental polariton dispersion under white light illumination is shown in Fig. 1b. The parabolic TE-and TM-polarized lower polariton branches appear as dips in the reflectance spectra. The figure also shows an example of how the laser energy, momentum and polarization can be precisely tuned to excite, in this case, the TE lower polariton branch at a given angle.


To try everything Brilliant has to offer—free—for a full 30 days, visit http://brilliant.org/ArtemKirsanov/
The first 200 of you will get 20% off Brilliant’s annual premium subscription.
My name is Artem, I’m a computational neuroscience student and researcher. In this video we talk about cognitive maps – internal models of outside world that the brain to generate flexible behavior that is generalized across contexts.
Patreon: https://www.patreon.com/artemkirsanov.
Twitter: https://twitter.com/ArtemKRSV
OUTLINE:
00:00 — Introduction.
02:08 — Edward Tolman.
03:48 — Zoo of neurons in hippocampal formation.
06:40 — Non spatial mapping.
08:21 — Graph formalism.
12:21 — Latent spaces.
17:22 — Factorized representations.
21:51 — Summary.
24:47 — Brilliant.
26:19 — Outro.
REFERENCES (in no particular order):
1. Behrens, T. E. J. et al. What Is a Cognitive Map? Organizing Knowledge for Flexible Behavior. Neuron 100490–509 (2018).
2. Constantinescu, A. O., O’Reilly, J. X. & Behrens, T. E. J. Organizing conceptual knowledge in humans with a gridlike code. Science 352, 1464–1468 (2016).
3. Aronov, D., Nevers, R. & Tank, D. W. Mapping of a non-spatial dimension by the hippocampal–entorhinal circuit. Nature 543719–722 (2017).
4. Whittington, J. C. R., McCaffary, D., Bakermans, J. J. W. & Behrens, T. E. J. How to build a cognitive map. Nat Neurosci 25, 1257–1272 (2022).
5. Whittington, J., Muller, T., Mark, S., Barry, C. & Behrens, T. Generalisation of structural knowledge in the hippocampal-entorhinal system.
CREDITS:


One of the largest mysteries of science is that humans have conscious awareness of their complex subjective experiences – or what we call “qualia” – such as being aware of what it’s like to delight in the color of a flower, melt into the comfort of a bed, or to feel sharp pain. Why and how qualia could emerge from physical matter and be a part of the human experience is unknown, and this is called the ‘hard problem’ of consciousness. Related to qualia is the mystery of why humans feel like they have free will, or the ability to intentionally choose and execute actions.
The ‘easy’ problem of consciousness is mapping these mind states to brain states, such as identifying which brain regions are active during a certain experience, such as smelling a flower. Despite advances in classical physics and neuroscience, many aspects of the mind-brain relationship, such as qualia, remain unresolved. New theories of mind are required to address this perennial mystery.
In a new paper, we propose that some aspects of mind are quantum and can play an active role in the physical world, explaining some of the unexplainable.

A few select users will now be able to enjoy Google Maps’ immersive view, according to a blog by the company published last month. The new feature is meant to allow users to reimagine how they explore and navigate, while helping them make more sustainable choices.
“Immersive view is an entirely new way to explore a place — letting you feel like you’re right there, even before you visit. Using advances in AI and computer vision, immersive view fuses billions of Street View and aerial images to create a rich, digital model of the world. And it layers helpful information on top like the weather, traffic, and how busy a place is,” said Chris Phillips, VP & General Manager, Geo, in the blog.
In this video, we will explore the positional system of the brain — hippocampal place cells. We will see how it relates to contextual memory and mapping of more abstract features.
OUTLINE:
00:00 Introduction.
00:53 Hippocampus.
1:27 Discovery of place cells.
2:56 3D navigation.
3:51 Role of place cells.
4:11 Virtual reality experiment.
7:47 Remapping.
11:17 Mapping of non-spatial dimension.
13:36 Conclusion.
_____________
REFERENCES:
1) Anderson, M.I., Jeffery, K.J., 2003. Heterogeneous Modulation of Place Cell Firing by Changes in Context. J. Neurosci. 23, 8827–8835. https://doi.org/10.1523/JNEUROSCI.23-26-08827.
2) Aronov, D., Nevers, R., Tank, D.W., 2017. Mapping of a non-spatial dimension by the hippocampal–entorhinal circuit. Nature 543719–722. https://doi.org/10.1038/nature21692
3) Bostock, E., Muller, R.U., Kubie, J.L., 1991. Experience-dependent modifications of hippocampal place cell firing. Hippocampus 1193-205. https://doi.org/10.1002/hipo.